AUC Explained
KKTV + KKStream 在 Kaggle 上辦了一個比賽,目標是猜測用戶在未來一週裡的上線時段(已去識別化)。前一陣子我利用週會的時間跟同事解釋過 AUC 的算法與用途,以下是投影片的逐字稿。
I am hosting KKTV Data Game 17.11, a competition about predicting user behaviors, on Kaggle. We chose AUC as our metric to evaluate the performance. This is the slide I used to explain AUC to colleagues.
What is AUC
AUC 是 Area Under ROC Curve 的縮寫,用來衡量二元分類模型的表現。
AUC stands for Area Under ROC Curve. It is a metric to evaluate the performance of binary classification problems.


ROC curve 是「接收者操作特徵曲線」。現在我們要建立這種曲線來評估「僵屍病毒檢測器」的效能,首先準備十個可供檢驗的案例,並且先隱藏 僵屍標籤 。
ROC stands for Receiver Operating Characteristic. We will build the ROC curve of a “zombie disease detection device” and use this curve to evaluate this device. There are 10 subjects here and we know whether they would become zombie in the future or not. But let’s hide the zombie labels for now.
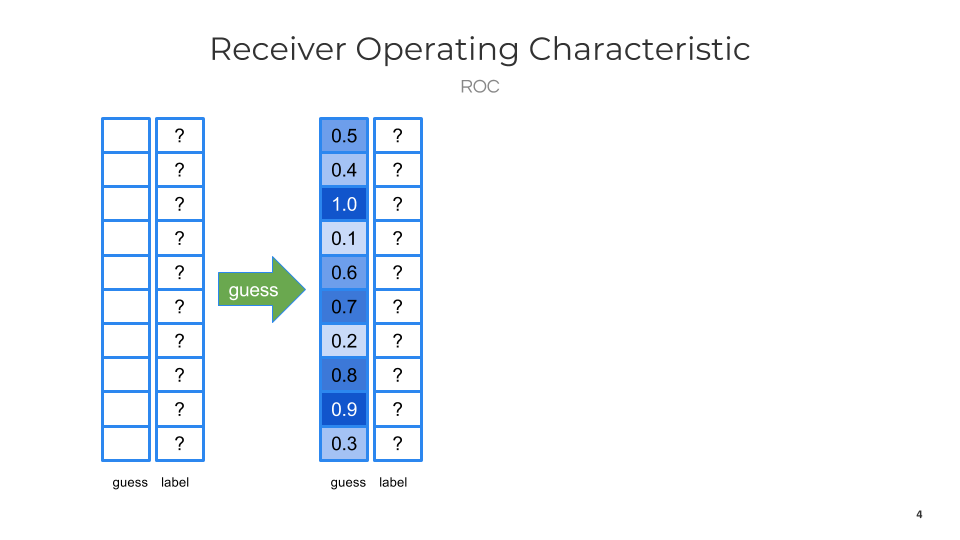
用「僵屍病毒檢測器」檢驗所有的案例,列出檢測器的信心指數。信心指數表示檢測器對判斷案例已被感染有多高的信心。
Use the device to predict a value (confidence) for each subject. It’s a value of how strong the device believes a subject is infected.
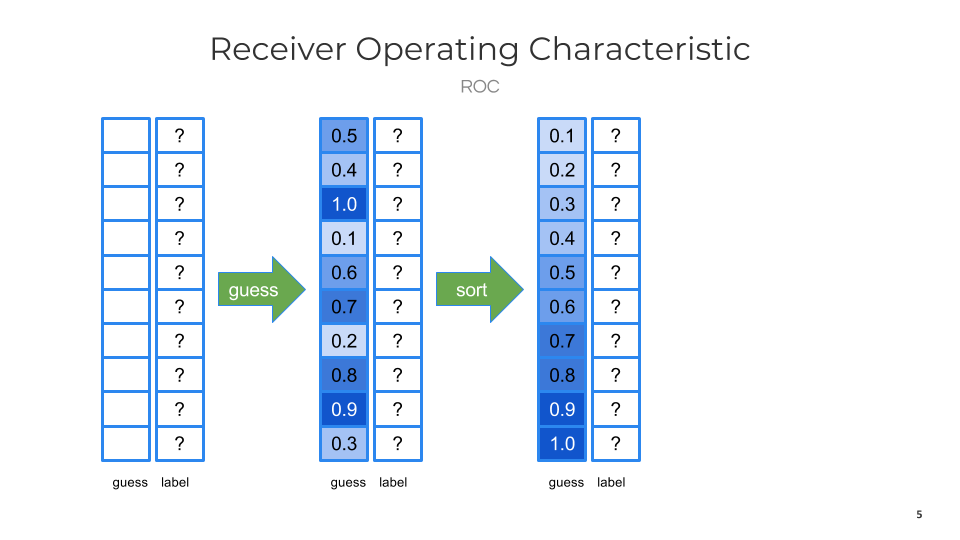
按照每個案例的信心指數將所有的案例重新排列。
Then we use the confidence as keys to sort all subjects.
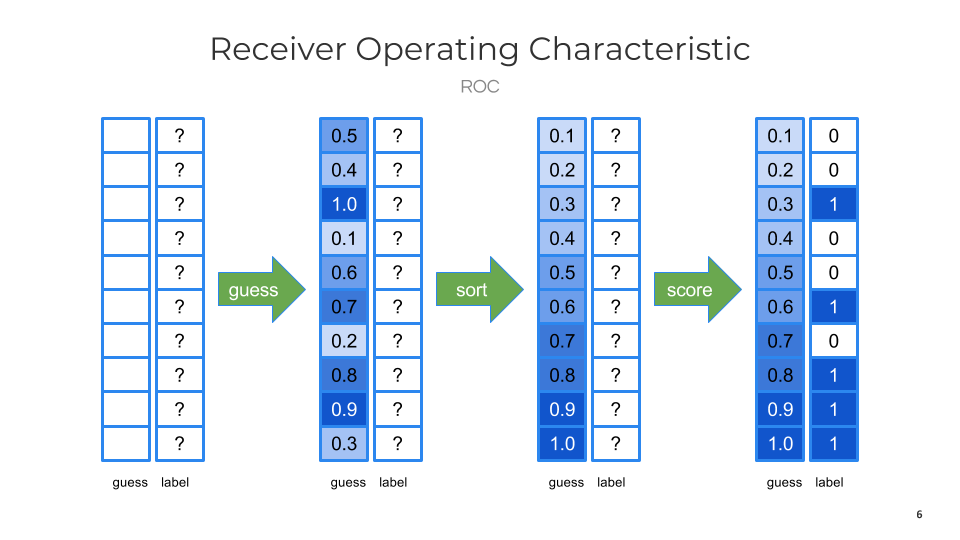
比較各個案例被感染的信心指數跟標籤,開始畫出曲線。
The ROC curve is drew by comparing the predictions and true labels.
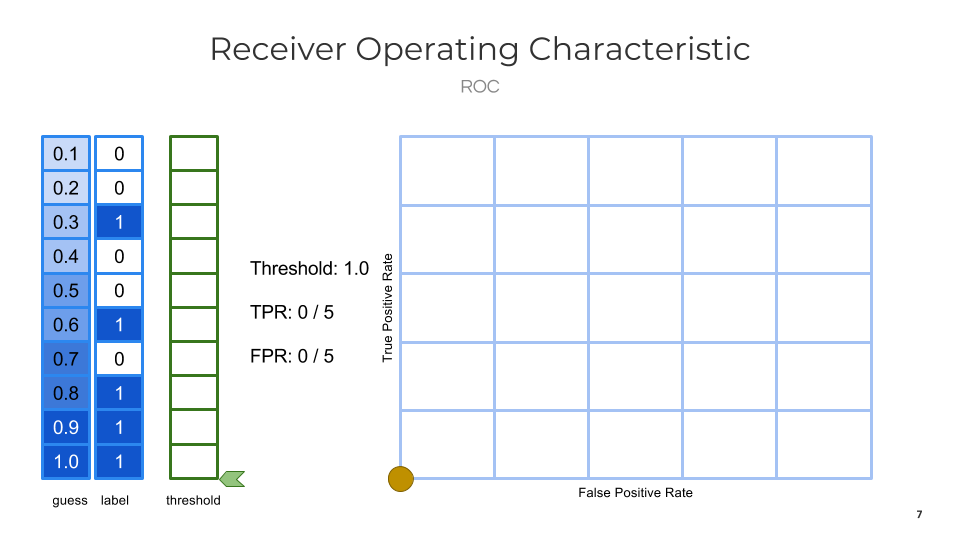
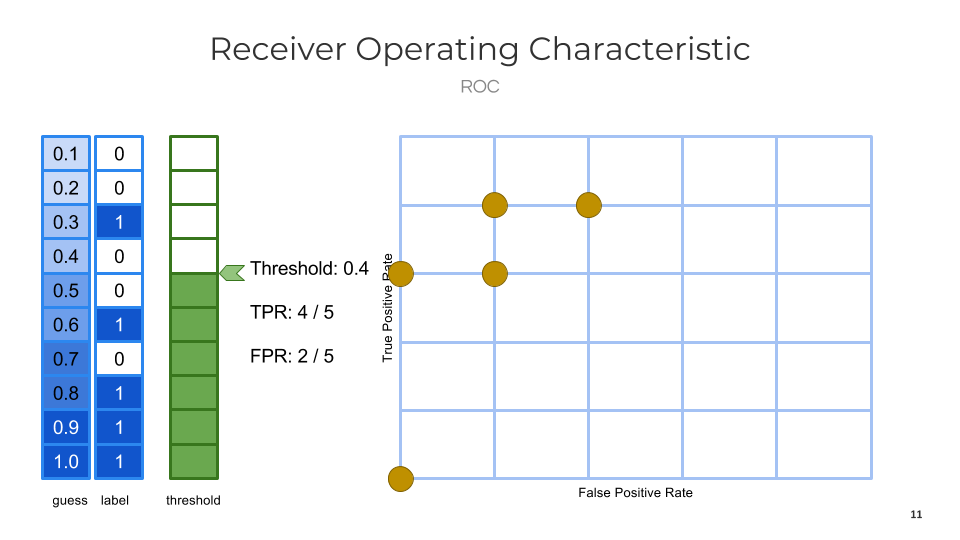
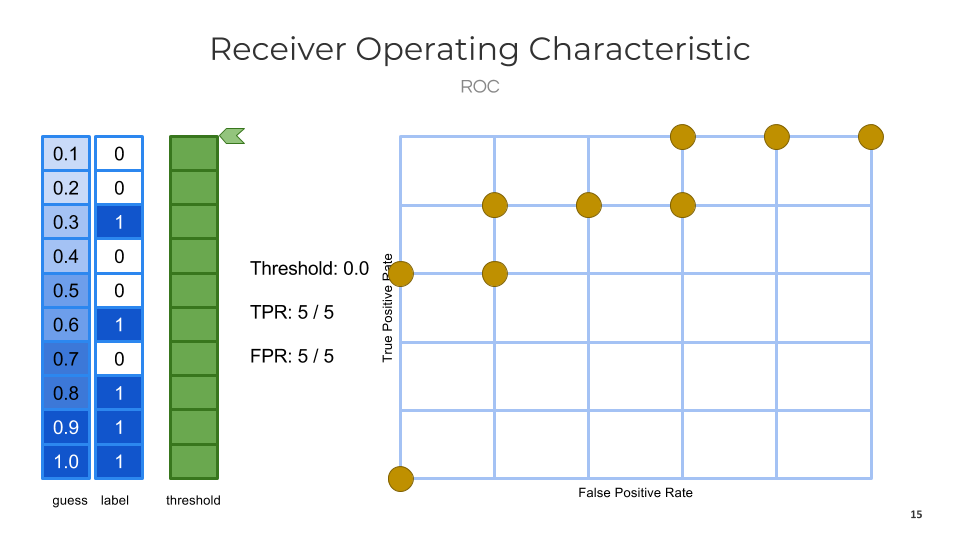
我們想根據信心指數把所有的案例分成兩組:是否被感染。所以挑一個閾值,只要信心指數高過閾值,就判定該案例已被感染;反之則判定為未受感染。首先將這個閾值設定為 1.0。因為最高的信心指數是 1.0,也就是所有案例的信心指數都不大於閾值,TPR 跟 FPR 都是 0.0,於是在圖表上 (0.0, 0.0) 的位置畫上一個小圈圈(左下角)。
- TPR : 在所有 已被感染 的案例裡,被檢測器跟閾值歸類到已被感染的比例。
- FPR : 在所有 未被感染 的案例裡,被檢測器跟閾值歸類到已被感染的比例。
We want to split all subjects into 2 groups: infected or not. A threshold is chosen for the judgement. If the confidence value is greater than the threshold, we consider it’s infected. All the others are considered as non-infected. In the beginning, we choose 1.0 as threshold. Because all confidence values are less than or equal to the threshold, both TPR and FPR are 0.0. So we draw a little brown dot on (0.0, 0.0) (the left-bottom corner).
- TPR : True positive rate. Among all infected subjects, what’s the ratio of subjects are classified as infected.
- FPR : False positive rate. Among all non-infected subjects, what’s the ratio of subjects are classified as infected.
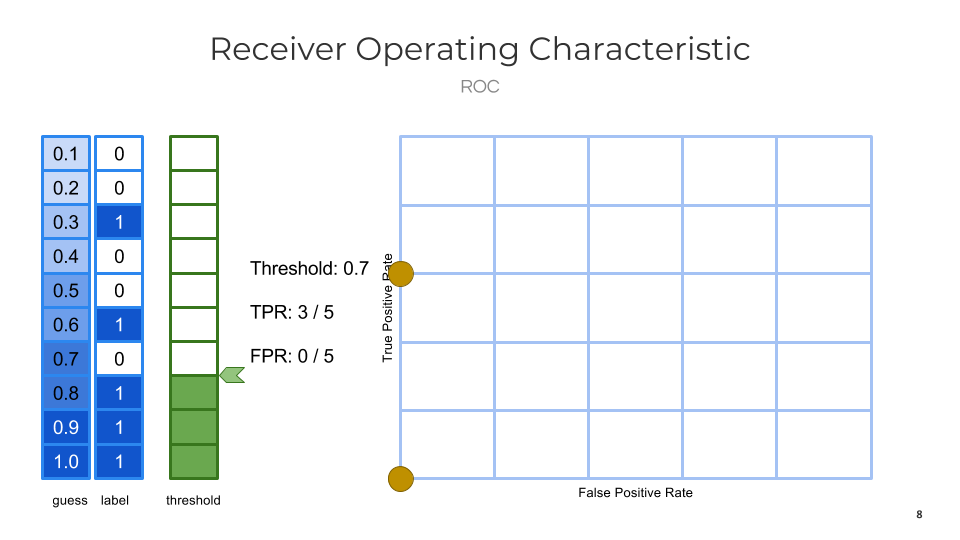
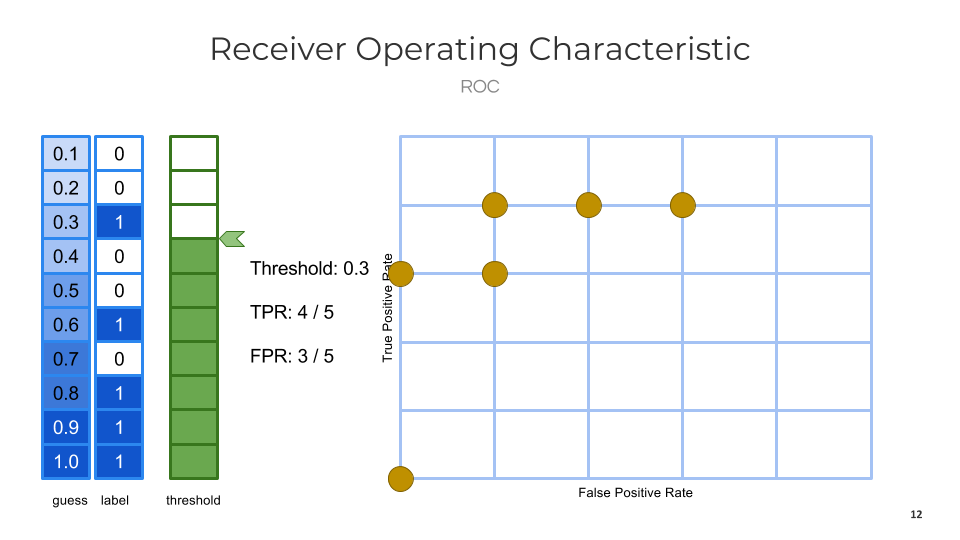
將閾值降為 0.7 。TPR 變成 0.6 (有五個案例已被感染,但是只有三個藍色案例的信心指數比 0.7 高,所以 TPR = 3/5)且 FPR 維持不變。在這個位子也畫上一個小圈圈。
Let’s choose another threshold: 0.7. TPR become 0.6 (5 subjects are infected but only 3 have confidence values greater than 0.7, so TPR = 3/5) while FPR is still 0.0. Put another little brown dot on the chart.
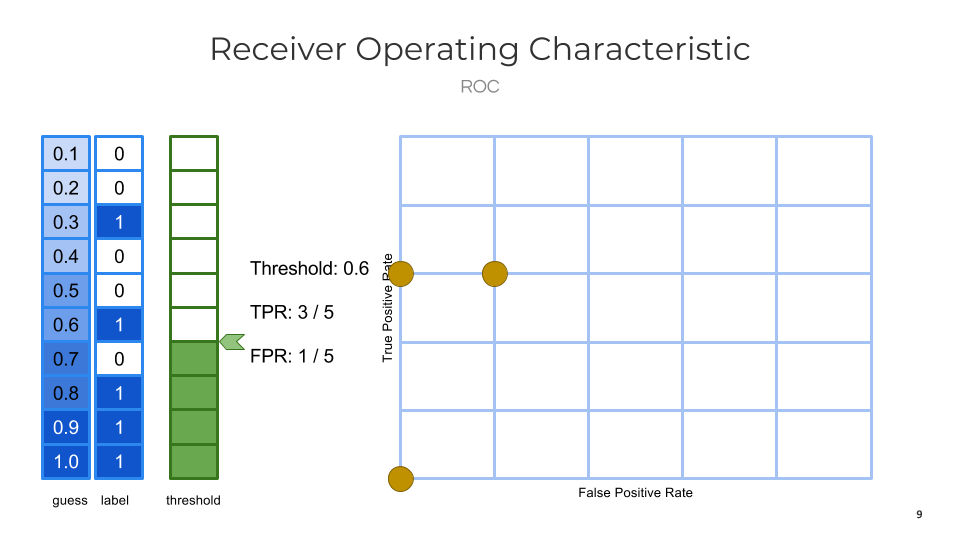
將閾值降為 0.6 。FPR 變成 0.2 (有五個案例未被感染,但是其中有一個白色案例因為信心指數高過閾值被判定成已感染,所以 FPR = 1/5)而 TPR 維持不變。在這個位子也畫上一個小圈圈。
Let’s choose another threshold: 0.6. FPR become 0.2 (5 subjects are non-infected, but one of them are miss-classified as infected because its confidence value is greater than threshold, so FTR = 1/5) while TPR is still 0.6. Put another little brown dot on the chart.
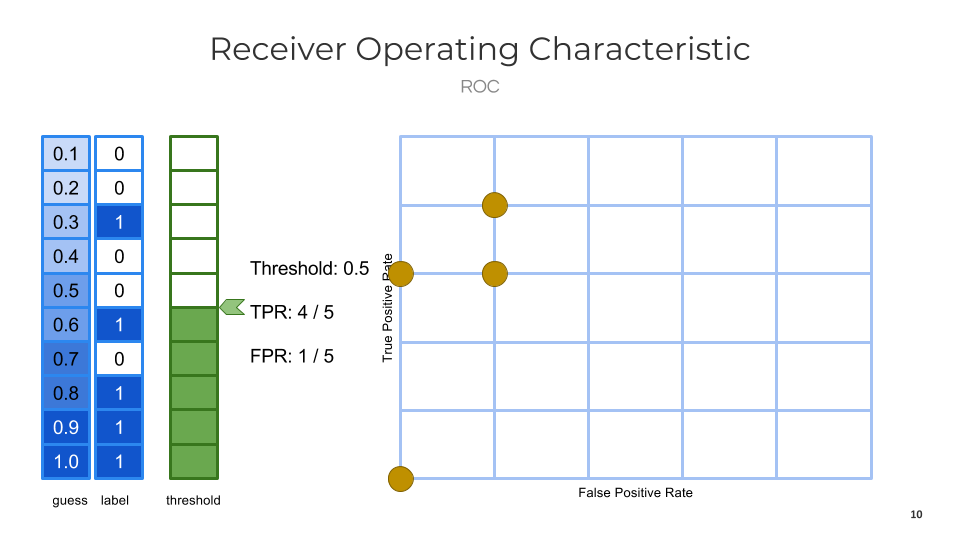
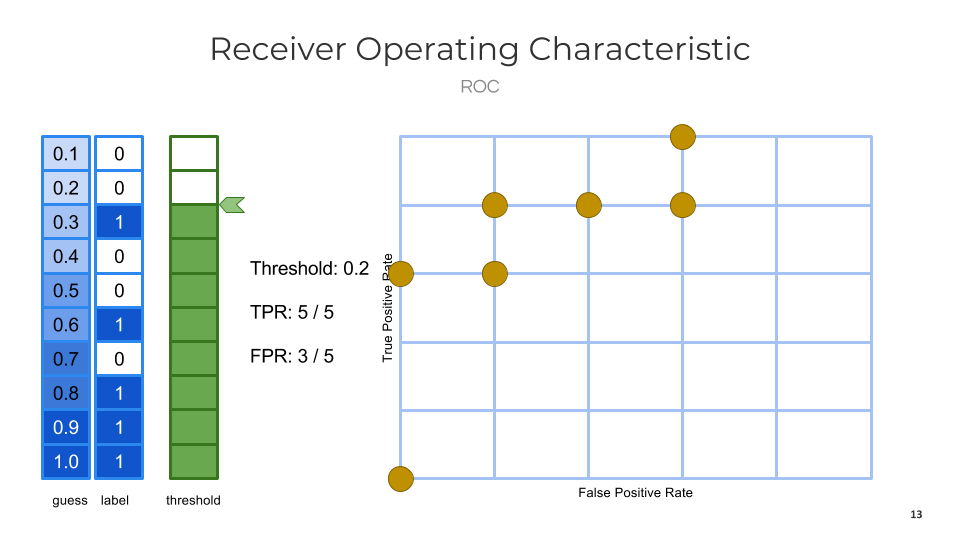
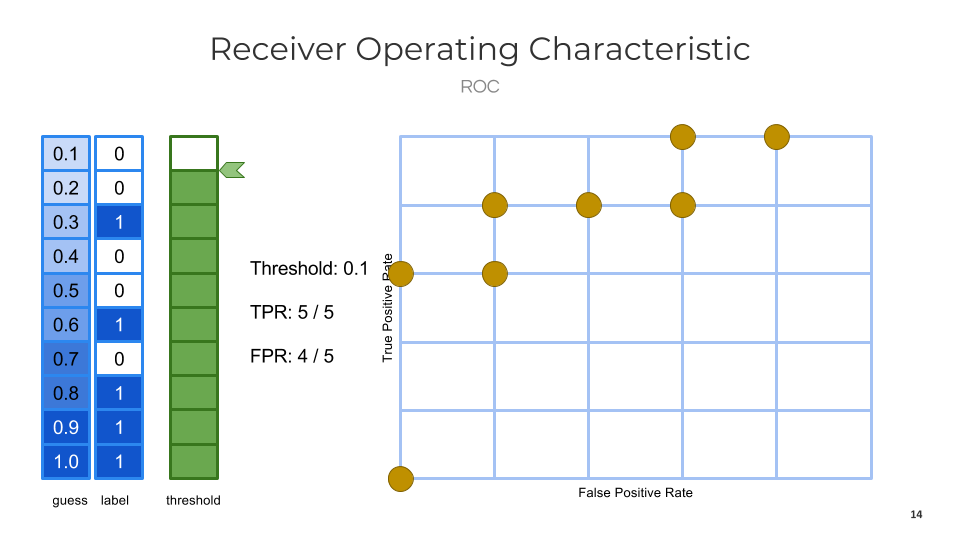
重復這個方法直到閾值變為 0.0,TPR 與 FPR 也變成 0.0 了,所以表格的右上角有一個小圈圈。
Repeat the process until the threshold become 0.0. Both TPR and FTR are 0.0 so there is a brown dot on the right-top corner of the chart.
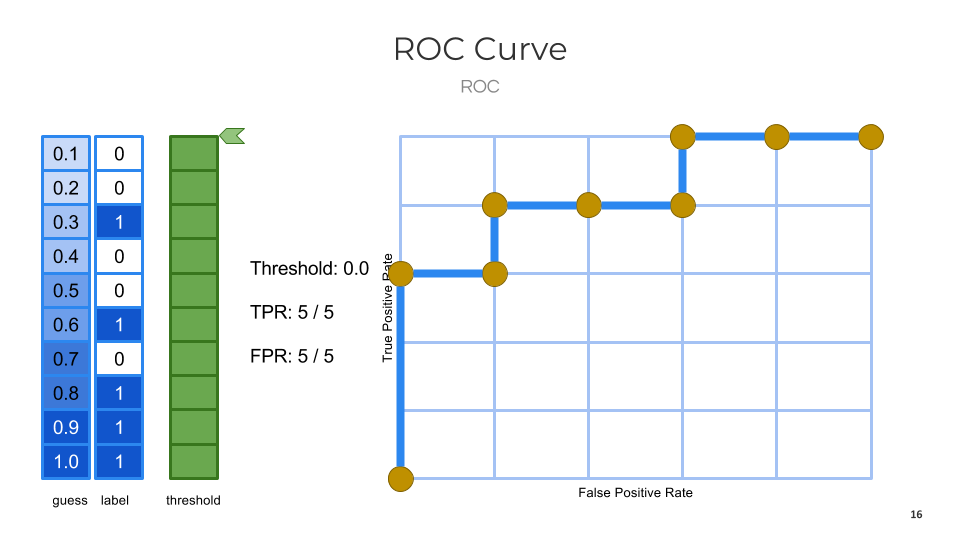
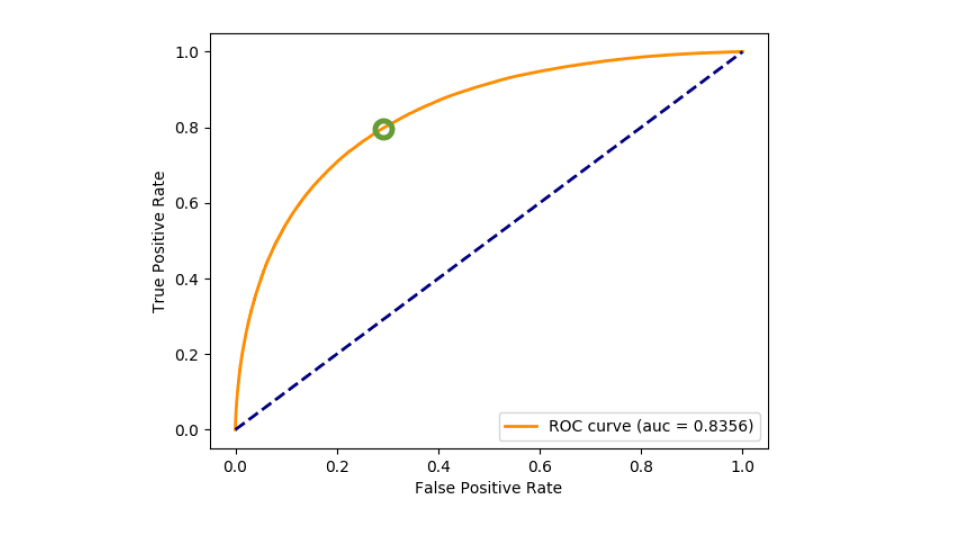
連接所有的小圈圈就得到一條曲線,這條曲線就是「接收者操作特徵曲線」。
Connecting all little brown dots gives us a curve. This is the ROC curve.
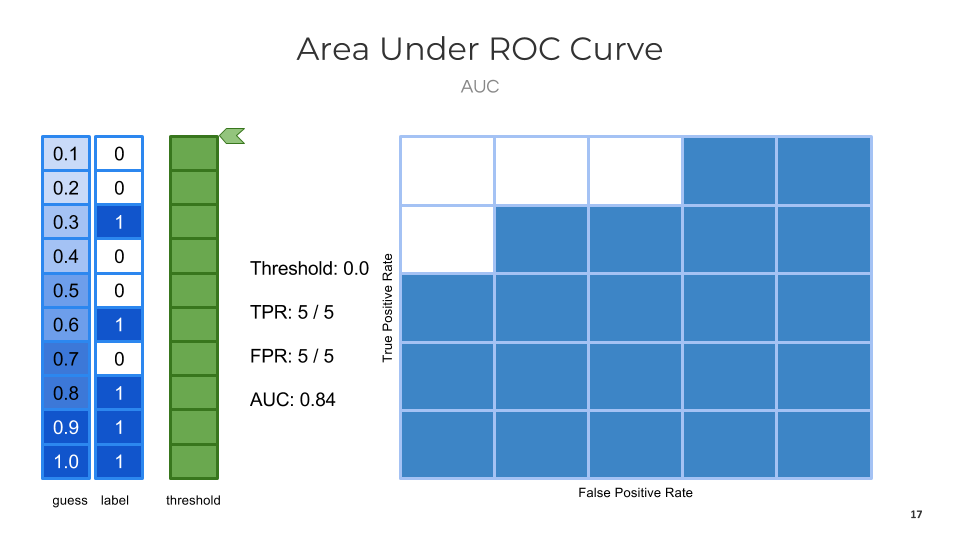
將曲線下方的區塊塗上藍色,藍色區塊的面積就是 AUC 了。這個曲線的 AUC 是 0.84 ,因為在表格上所有的 25 格裡,有 21 格被塗成藍色,AUC = 21/25 。
Area under the ROC curve, blue blocks on the chart, is AUC. In this chart, AUC is 0.84 (21 blue blocks, area of each block is 1/25 = 0.04).
How can We Use AUC?
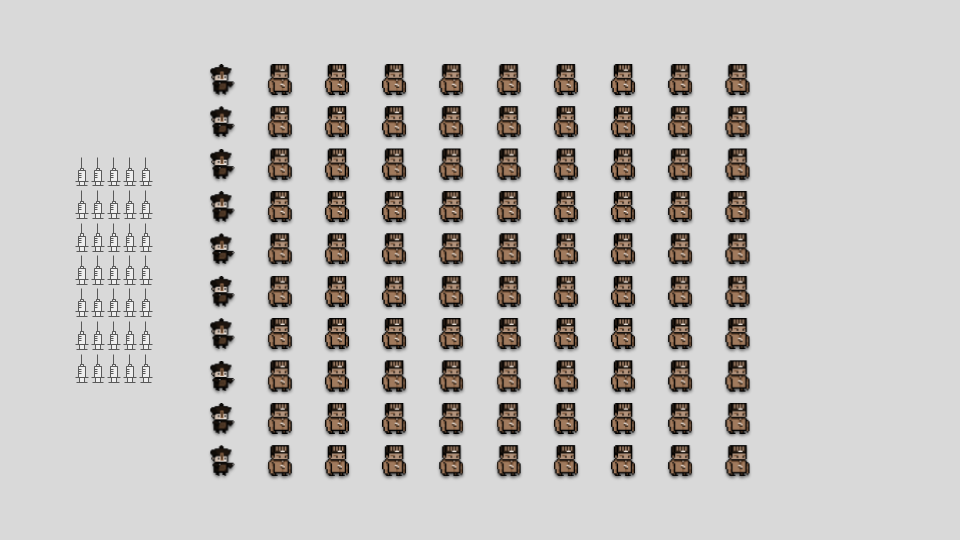
- 假設有100個案例。
- 根據統計結果,案例中的一成已被感染,也就是十個案例。
- 我們還沒辦法確定哪些案例已經被感染了。
- 我們有「僵屍病毒檢測器」了。
- 運氣不錯,已經能做出解毒劑了;運氣不好,只做得出35份。
-
我們該怎麼運用這些解毒劑?
- Assume there are 100 subjects.
- According to statistic, 10% of subjects are infected (10 subjects).
- We do not know who is infected.
- We have zombie disease detection devices.
- We have only 35 cures.
- How can we use those precious cures?
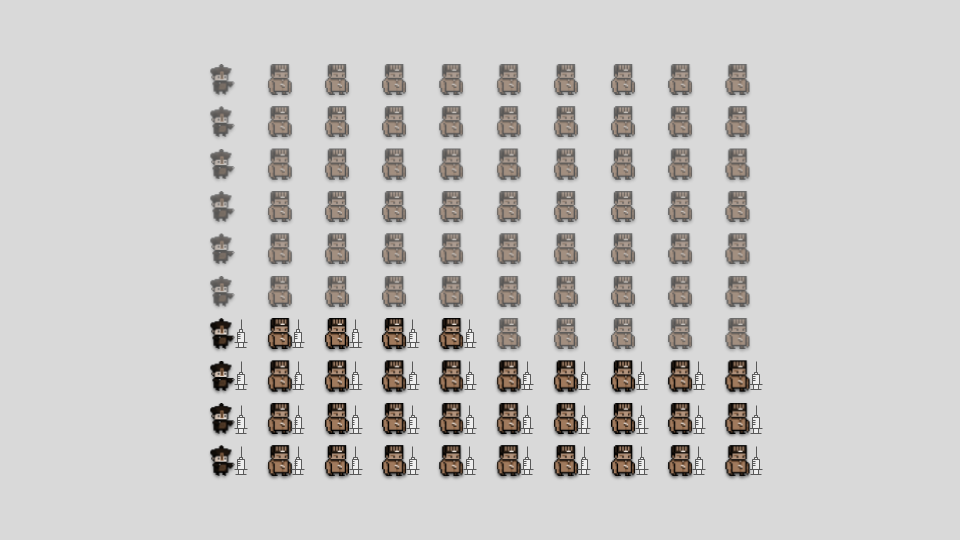
- 我們隨機挑35個案例打針。
- 但是只有一成的案例被感染。
-
31 份解毒濟被浪費掉了!
- We choose 35 subjects to cure, randomly.
- But there are only 10% of subjects are infected.
- 31 cures are wasted!
- 「僵屍病毒檢測器」登場。
-
我們知道 ROC 了,挑了一個閾值使得 TPR 是 0.8 且 FPR 是 0.3。
- Here comes the zombie disease detection devices.
- We know the AUC and we choose a threshold so that th TPR is 0.8 and FPR is 0.3.
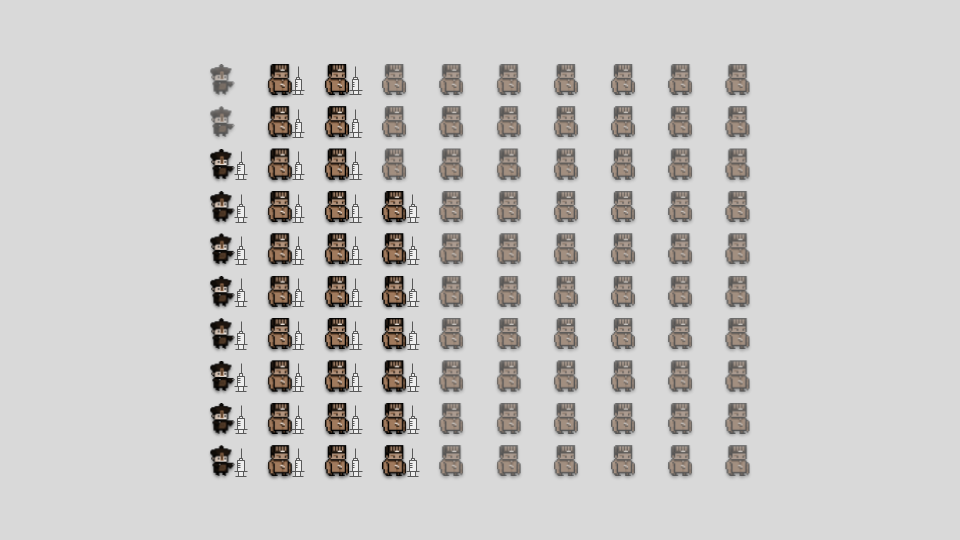
- 根據這個閾值,對所有被判斷已感染的案例打針。
- 因為 TPR 是 0.8,所以已感染的案例中有八成的機會被檢測出,也就是八個已感染的案例被治癒。
- 因為 FPR 是 0.3,所以未感染的案例中有三成的機會被檢測錯,也就是 27 個末感染的案例被打針。
-
只有 27 份解毒劑被浪費,而且多治癒三個案例。
- According to the threshold, we give cures to those who are classified as infected subjects.
- Because TPR is 0.8, 80% of infected subjects are detected. So 8 subjects are cured.
- Because FPR is 0.3, 30% of non-infected subjects are miss-classified. So 27 subjects are bitten…pity.
- Only 27 cures are wasted, and 3 more infected subjects are cured.
簡單說,有了 AUC ,就可以根據 AUC 跟需求調整閾值,對資源做更有效的運用。
So we can use our resource more efficiently if we know the AUC of prediction model and pick a better threshold.